Charts
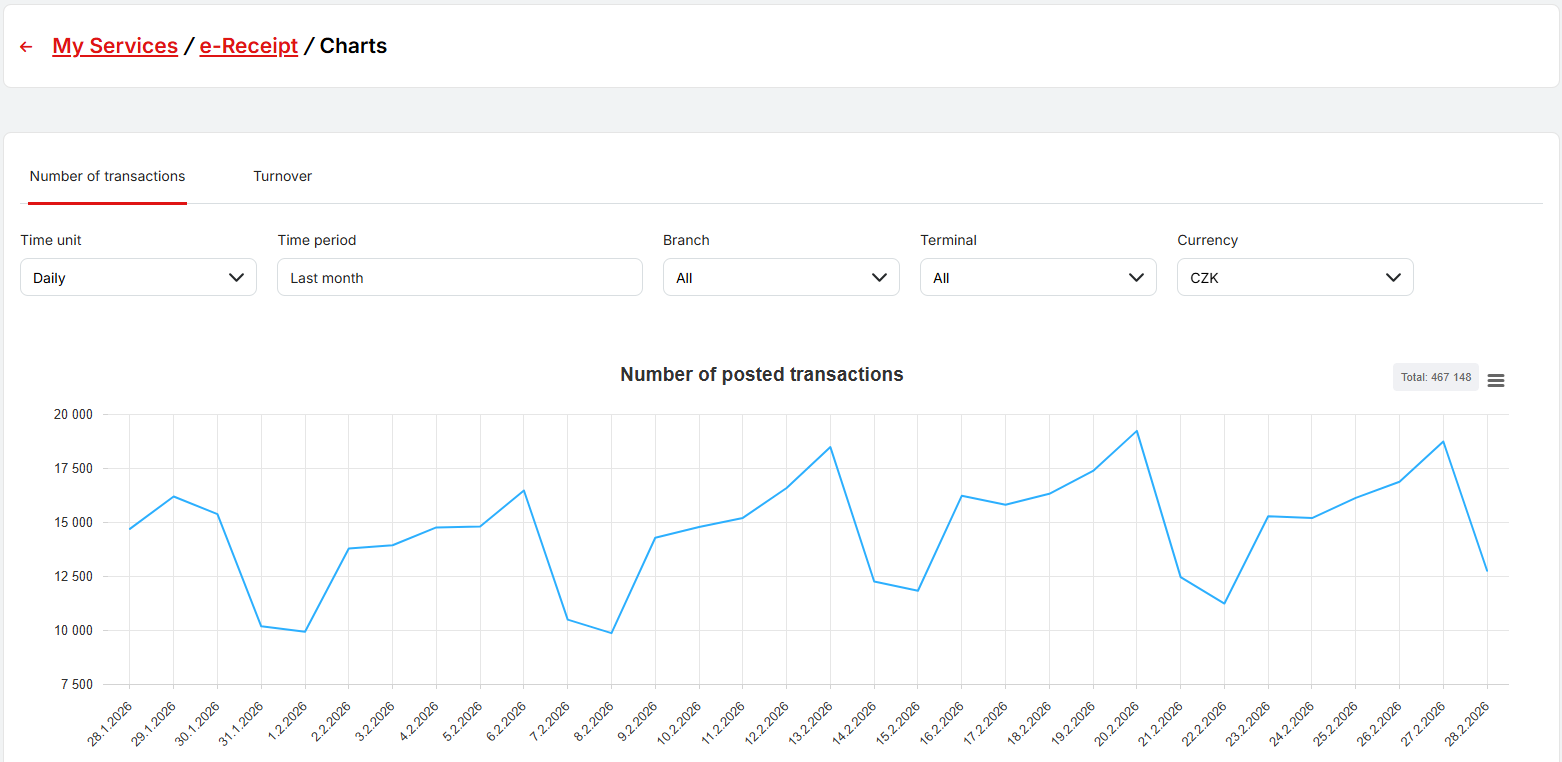
On this page, you will find graphical overviews of transaction count statistics and total turnover. Using the filters at the top of the page, the chart display can be adjusted according to the selected time unit (daily, weekly, monthly, or yearly), chosen period, specific branches, terminals, and currency.
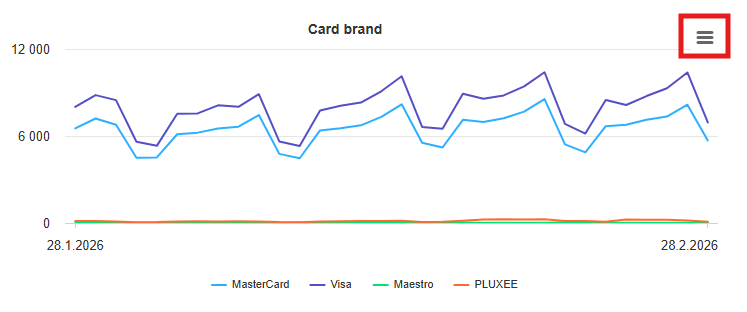
For individual charts, the actions menu can be expanded in the top right corner. The chart can be displayed in full screen and downloaded as an image in PNG, JPEG, SVG, or PDF format.